
Our group research question was, “What is the abundance of Recruits, compared to adult Males and Females, over Time (from 2003-2013) at Ocean Beach from the data collected by a specific school?” Basically, we asked if the number of juvenile sand crabs (aka recruits) has had any significant changes compared to the number of mature adults that are on the beach.
Your initial reaction to this question might be to ask, “Why should we care?”, because until now there’s a large chance you didn’t even know sand crabs existed. To answer that question our group had to take a step back, and understand the crabs role in the marine community. We have since learned that they are important food sources for the shore birds, and local fish so their populations reflect how those predators and even the crabs’ prey are doing. So, by tracking sand crab population,s scientists are able to keep tabs on how healthy places like Ocean Beach are, and to see if that marine community needs more attention.
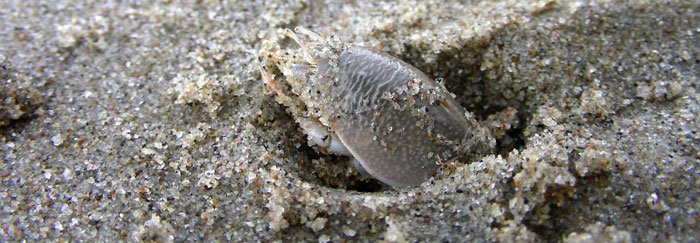
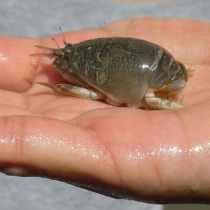
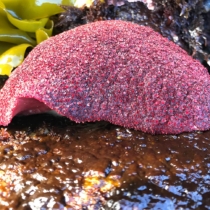
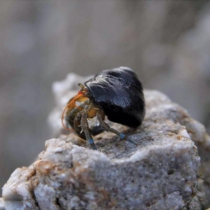
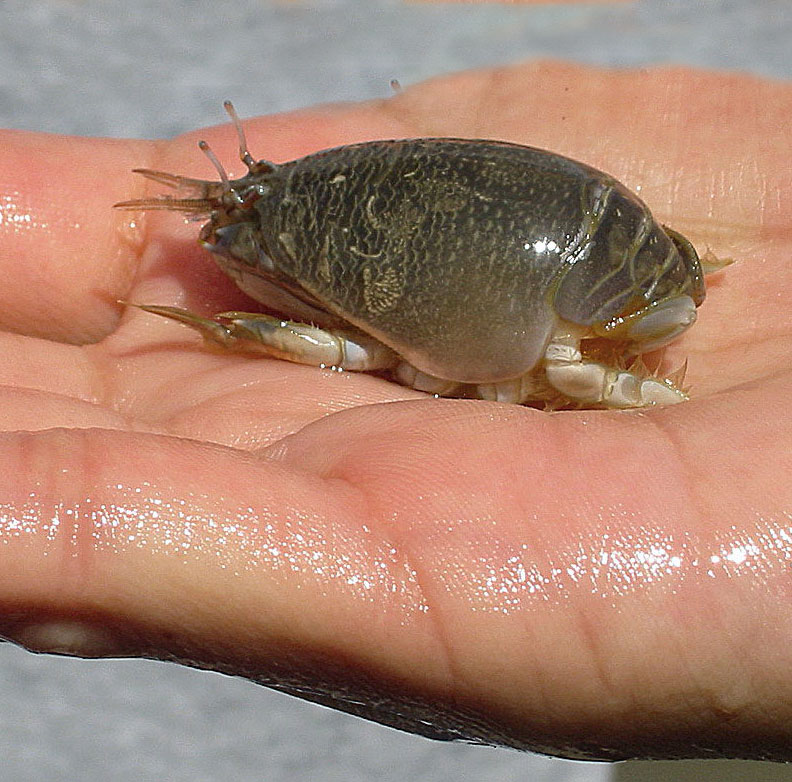
Sand crab buries self under sand on beach.
In order to measure this impact, we have compiled data taken multiple times a year since 2003 by students from a specific school and plotted them on a graph. Acquiring this data was no easy task, and required a few dozen lucky students to manually catch, count, and sex each sand crab by hand three times a year.
Think about it: by monitoring sand crabs, scientists could help to make sure that your favorite sushi is always stocked because sand crabs are the base of coastal food chains. And measuring the number of recruits allows the scientists to see how successful the last spawning season was.
Now to talk about our data!
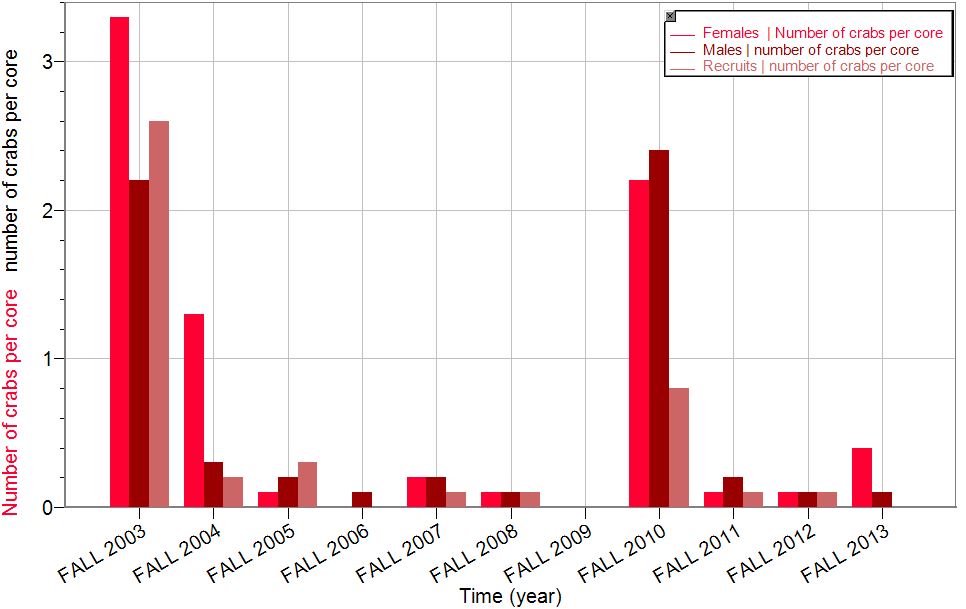
Graph of Number of Sand Crabs Over Time
**Note: The females are the bright red bar on the left side of each year. The males are the middle dark red bar and the recruits are the light red bar on the right side of the year**
At first glance, there’s not much of a pattern between the years and the numbers of crabs. But in reality there is a boom and bust pattern, which means a large population increase followed by crazy population lows. The years 2003 and 2007, both experienced these booms and the years following them had a much lower population count, otherwise known as a boom and bust pattern.
The highest number of females and recruits were found in fall 2003, and there were a lot more females than males or recruits. On the other hand, the most males were found in fall 2010. Also it should be noted that there is no data in fall 2009 because that was the only year that data was not able to be collected.
You would think that there would be some type of relationship between females found on the beach and the number of recruits because if more females are having babies, there will inevitably be more juveniles; however, there does not seem to be any relationship at all. For example, in fall 2005 there were a lot more recruits than females whereas in fall 2004 and 2010, there were at least twice as many females then there were recruits.
We think this is because after recruits hatch, they go to live in the ocean and are swept away to beaches all around the world, so there no guarantee that a lot of females one year means a lot of recruits the next, or vice versa.
From Articles
In an article, “The Pacific Mole Crab” by the Farallones marine Sanctuary Association, they mention that the female crabs lay their eggs from February to October. In our data, for almost all of the years, there were fewer recruits than adults in the fall.
This could be because the females had recently laid their eggs, and they eggs hadn’t hatched yet. The article also says that the young crabs go through many larval stages, so they could have been too small to see when the data was collected.
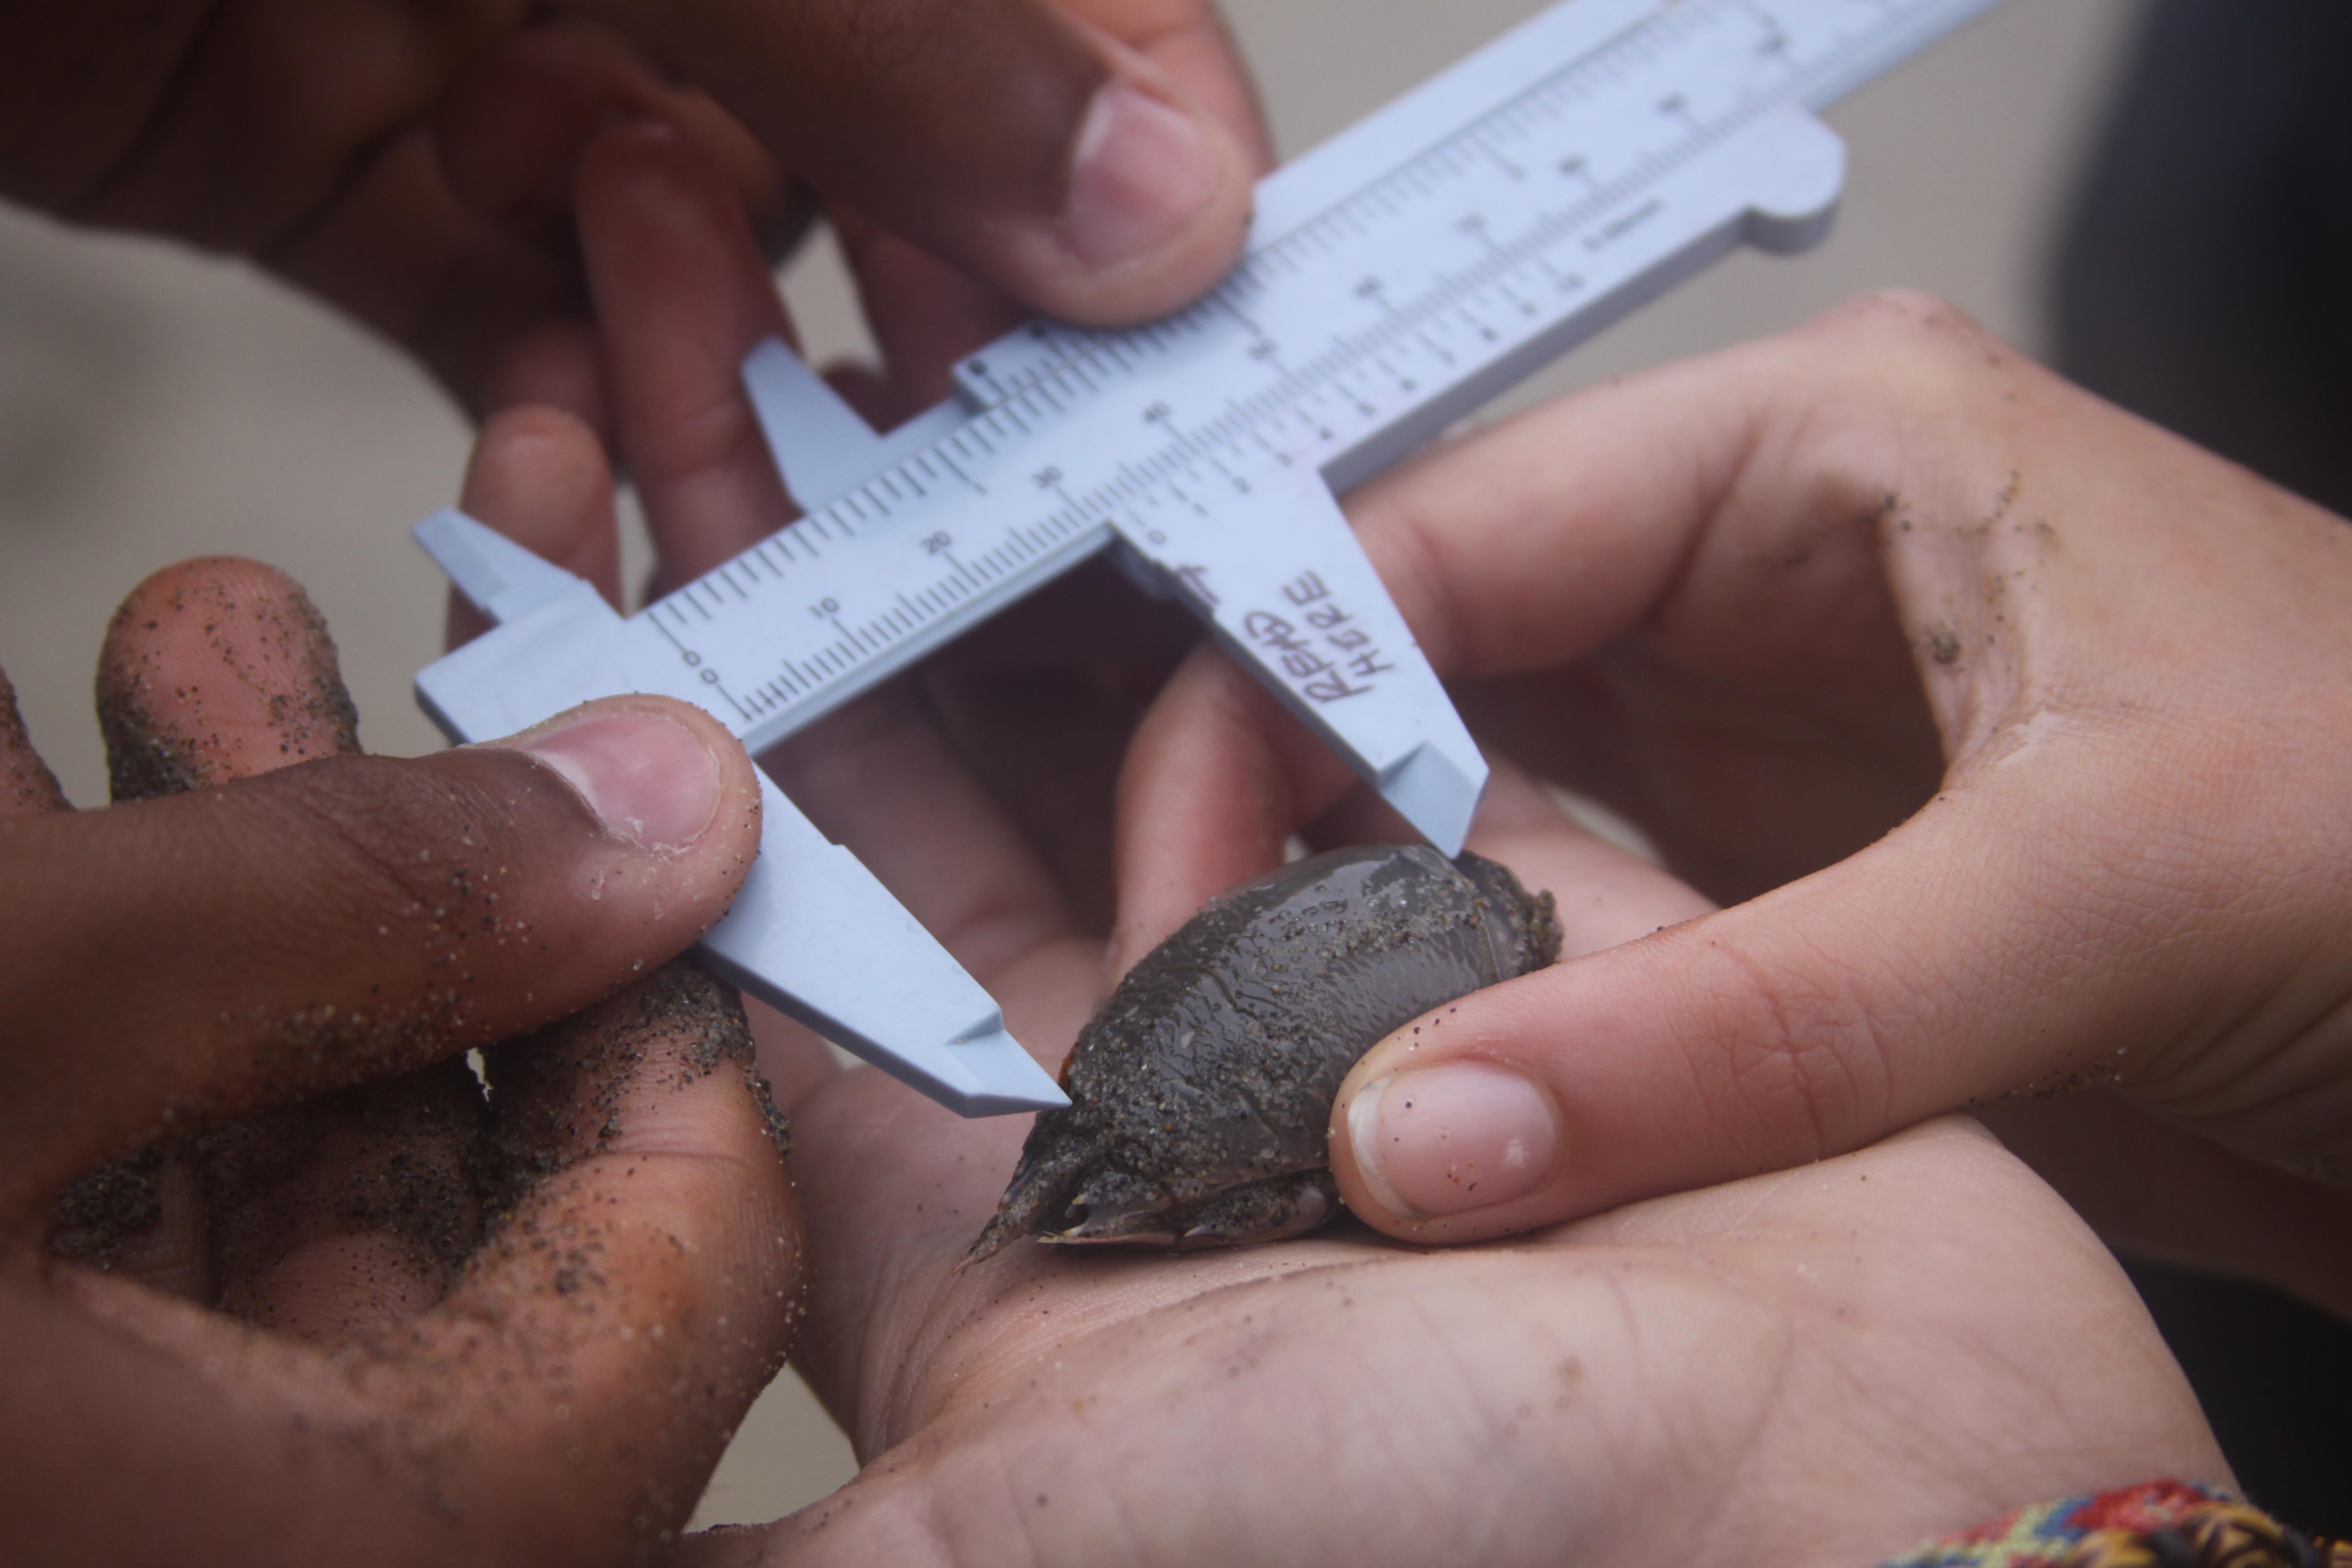
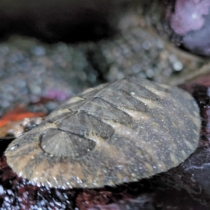
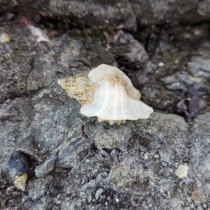
Measuring a Sand Crab
A second study by Contreras et al on sand crabs in South Central Chile found that sand crabs were most abundant in late spring and early summer. These findings stand out because the crabs reproduce all year, so it can be surmised that they have the most reproductive activity during the summer. This activity is also reflected by the number of recruits which highest in early autumn and spring.
The article continues to talk about sand crab data collected from June 1989 to May 1991, and states that consistently in these years, there was around the same number of males and females found, with slightly less females being found. There was also about half as many recruits as females.
However, the data from Contreras et al shows that there were a lot less pregnant females than females without eggs. Since most of the females we found had eggs, we think this may suggest that females are having more eggs now than in the previous 20 years.
Reading on, curiosity about the sand crab populations lead us to another articled called,“Life History”. The data cited in the article suggests that the numbers of sand crabs may have been much more stable in the 80’s than it is now because we found that the number of sand crabs was extremely variable in the past 10 years.
Also, In the article “Geographic variation in life history of the sand crab, Emerita analoga (Stimpson) on the California coast: Relationships to environmental variables” by Jenifer E. Dugan, David M. Hubbard, and Adrian M. Wenner, they said the younger crabs made up most of the population in the northern areas. They also said the females’ population varied on the northern and central coast.
In 1986 and 1987, the female and male populations were still very similar, but the population of the young crabs was much more significant and greater than that of the males and females.
We want to know how the populations of females, males, and recruits differ over time. Like the article, the female population at a northern/central coast varied. Our data showed that the recruits were rarely a large part of the sand crab population on the beach, unlike the article’s data.
It’s fascinating to see how the populations of sand crabs from the present differ from the past, like the decrease in the population of recruits from the 1980′s to now. What could have caused this? Pollution? Temperatures changing? It’s also interesting to see how the female’s population varies in the past and in the present. What could be causing this? These questions would be something to look into.
Our research of sand crabs has taught us the importance of protecting every aspect of our environment, even the small parts (like sand crabs) that people don’t really know about. By protecting creatures like sand crabs, we can make the world better not only for the animals, but for ourselves as well.


It is pretty remarkable how populations of crabs change on the beach from year to year! I also thought that your disucssion about LiMPETS data compared to the published research was very thoughtful. Given what you know about variability of these critters, do you think it is really possible for someone to draw conclusions about ‘how sand crabs are doing’ based on just a few years of data?
I like your thinking. It was very interesting to see that you guys actually think recruits being “swept away” by water currents is a possible explanation of why there are so few recruits comparing to adults; our group had a similar question to yours but didn’t think of that. (HY)
I like your question. I also like how you brought up why sand crabs were important in the beginning to keep readers engaged and basically give this blog meaning to read. The “boom and bust pattern” really interested me that if there are lots of female sand crabs on the beach one year means that there will be an abundance of recruits. And I agree, recording and keeping this data is important especially to basically keep an eye out on other marine life other than sand crabs. Great work guys!