Cleo, Jerome, Kate, and Gloria
Bishop O’Dowd High School
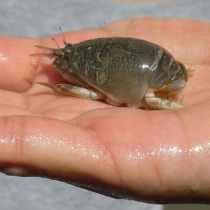
No need to feel clawstrophobic (or get crabby), there is plenty of room for all the sand crabs on Playa del Rey Beach! So, how has sand crab population changed over time on this Southern Californian beach? This question allows us to further understand the Southern California sand crab population.
All students who participate in Sandy Beach Monitoring with LiMPETS do the exact same protocols. To measure the distribution of sand crabs, we set up transect lines, 10 meters in length and perpendicular to the 50-meter survey line, and we stuck markers from the top of the swash zone every meter for 10 meters into the water. Using a core, we collected sand crabs at each marker, measured their carapaces with calipers, determined whether they were male or female (if they were female, we determined if they had eggs or not). If the length of the carapace was under 10mm, we considered them a recruit, which are new sand crabs on the beach that may not have its sex features visible.
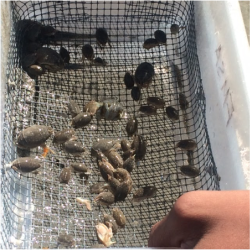
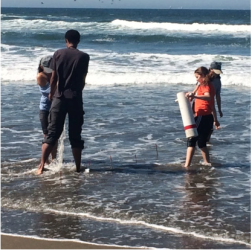
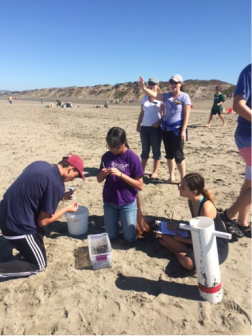
Our class at Ocean Beach collecting sand crabs and recording data, September 19, 2015.
According to both graphs, meter one is the core taken from the top of the swash zone, while meter 10 is deeper, closer to the surf zone. In December 2009, there were less crabs per transect than in June of 2011. The highest number of crabs per transect in 2009 was 5, while the highest number of crabs per transect in 2011 was 31. While this is positive evidence towards the notion that the sand crab population is growing, scientists need to continue to collect data from this beach before we can be absolutely sure that there is an increasing trend in the population.
The overall population grew according to our graphs. With the help of these graphs we are able to see that the crab population was thriving and growing throughout the Playa Del Rey beach. Unfortunately, today, we are unable to determine whether the sand crabs are still thriving at Playa Del Rey beach; with further monitoring efforts the health of this beach could be indicated. So, does this call for a field trip to sunny Southern California?
![Distribution of [male and female] crabs along Playa Del Rey beach in Dec. 2009.](https://limpets.org/wp-content/uploads/2015/11/Sand-Crab-Graph-2.png)
Distribution of [male and female] crabs along Playa Del Rey beach in Dec. 2009.
![Distribution of [male and female] crabs along Playa Del Rey beach in June 2011.](https://limpets.org/wp-content/uploads/2015/11/Sand-Crab-Graph-1.png)
Distribution of [male and female] crabs along Playa Del Rey beach in June 2011.
More info!
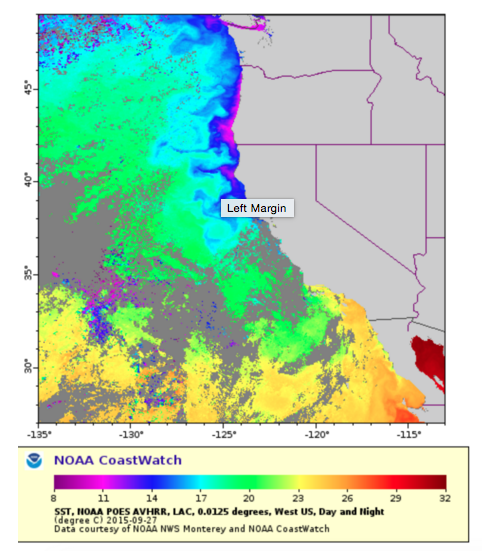
Temperature variances along CA coast (north→south). Water is about 73 degrees at Playa Del Rey Beach.
Using this information we concluded that as the coastal temperature increases, from the north to the south, the population of ovigerous crabs decreases. In conducting this experiment and analyzing our data, we were able to further understand the influence of the location, the swash zone, on the abundance and if they are female, a female with eggs, a male, or a recruit.

WoW! Your research is awesome! Don’t ever lose your enthusiasm and excitement for learning about the ocean and marine life. Make it your life-long passion and all the world’s population will benefit! Thank you!
Your group had very funny jokes in this blog. This is great because it catches the attention of the reader and makes them want to read more. Also I really enjoyed how you talked about your procedure and how it connects with the final conclusion as well as your topic.
Your group had very funny jokes in your blog. This is great because it catches the attention of the reader and makes them want to read more. Also I really enjoyed how you talked about your procedure and how it connects with the final conclusion as well as your topic that was stated in the beginning.